
In the fast-evolving world of Ethereum rollups, shared sequencers have emerged as a pivotal innovation, promising decentralized ordering that multiple Layer 2 networks can rely on without the pitfalls of single-operator bottlenecks. As rollup adoption surges, the need for real-time dashboards for shared sequencer rollup operations has never been more pressing. These tools offer node operators, developers, and researchers unprecedented visibility into performance, enabling proactive management of latency spikes, reorg events, and fairness protocols. Platforms like SharedSeqWatch. com stand at the forefront, delivering rollup operations monitoring that turns raw data into strategic insights.
Decentralizing Sequencing: From Centralized Risks to Shared Resilience
Traditional rollups often hinge on centralized sequencers, creating vulnerabilities like vendor lock-in, outage risks, and governance challenges, as highlighted in analyses from sources like 7blocklabs. Shared sequencers flip this script by pooling transaction ordering across a distributed network, whether leveraging Solana's speed via Rome Protocol or Ethereum's validators in based rollups. This shift reduces single points of failure, enhances fairness, and scales Ethereum's ecosystem more robustly.
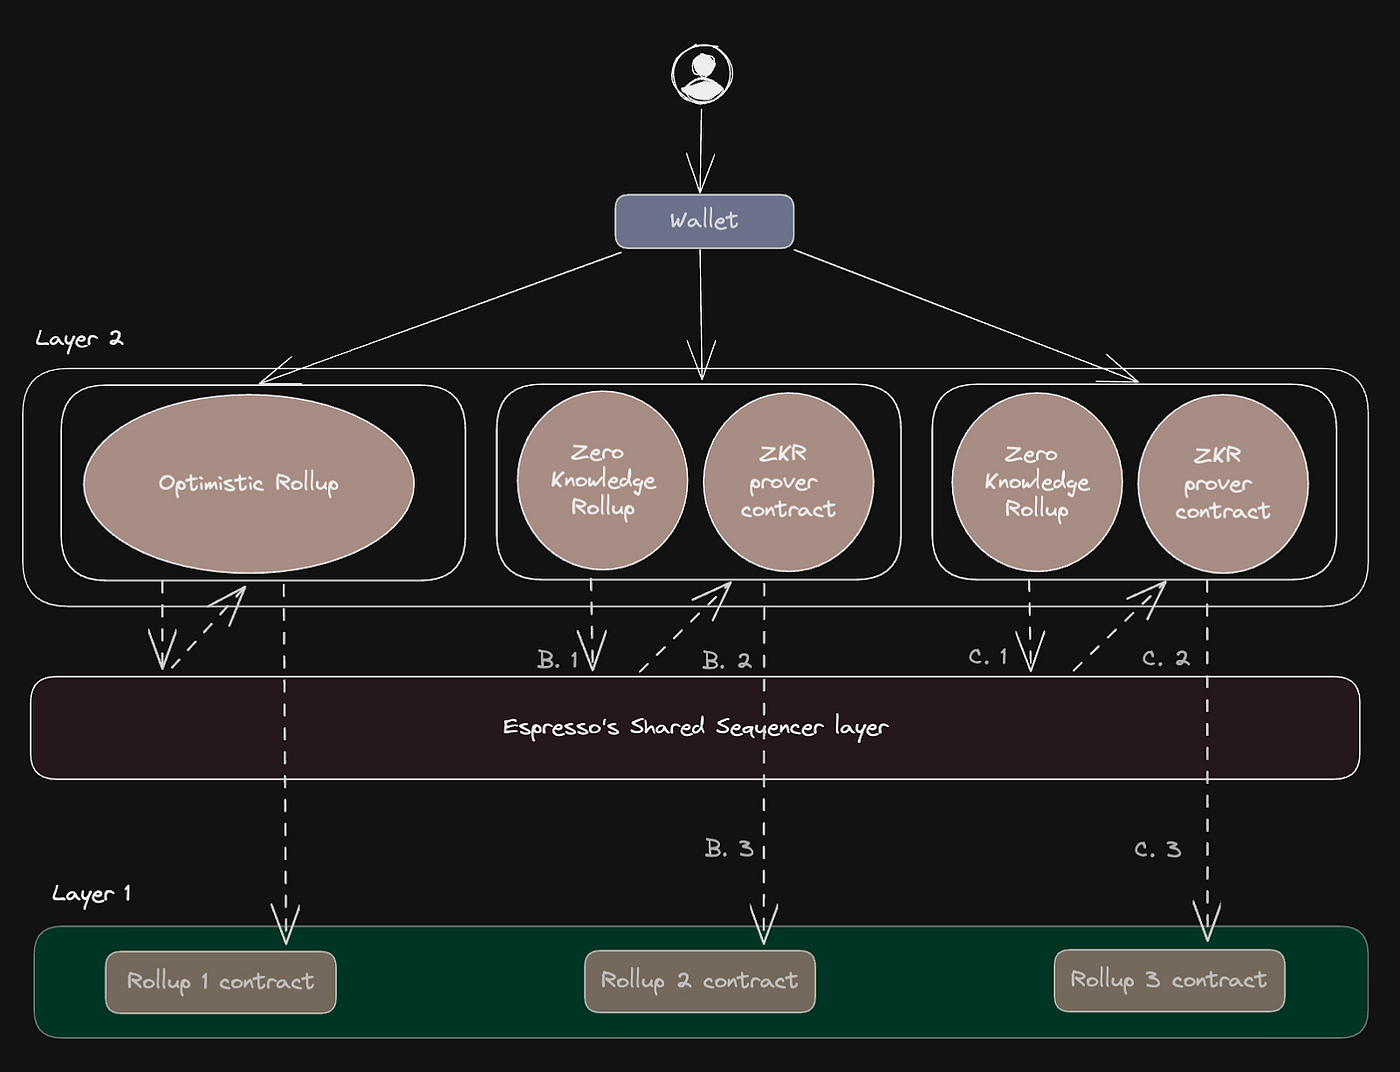
Consider Espresso's coordination layer or UniFi's preconfirmation model; they bridge execution-optimized rollups while mitigating centralization critiques leveled at Ethereum's L2s. In my 12 years blending technical and fundamental analysis, I've seen how these advancements foster diversified DeFi strategies. Yet, without precise real-time Ethereum metrics, operators risk blind spots in sequencer uptime or block production rates.

The promise is clear: shared sequencing schedules transactions independently for multiple chains, sorting and batching them efficiently before L1 settlement. But realizing it demands vigilant oversight, where dashboards illuminate hidden dynamics like gas usage per block or proof submission lags.
Essential Metrics on the Shared Sequencer Dashboard
A robust shared sequencer dashboard must track core indicators: latency from transaction submission to inclusion, reorg frequency that could disrupt finality, and fairness scores measuring MEV extraction equity. SharedSeqWatch. com excels here, benchmarking these against industry standards to spotlight bottlenecks early. For instance, monitoring sequencer performance reveals if a network like StratoStack maintains optimal block rates or falters under load.
StratoStack's offerings, with network overviews and live metrics integration via Prometheus and Grafana, exemplify this. Operators can set alerts for uptime dips or anomalous gas patterns, ensuring rollups hum smoothly. In practice, I've used such sequencer performance dashboards to validate protocols, confirming that shared models indeed outperform siloed ones in resilience during peak throughput.
Ethereum Technical Analysis Chart
Analysis by William Chen | Symbol: BINANCE:ETHUSDT | Interval: 4h | Drawings: 8
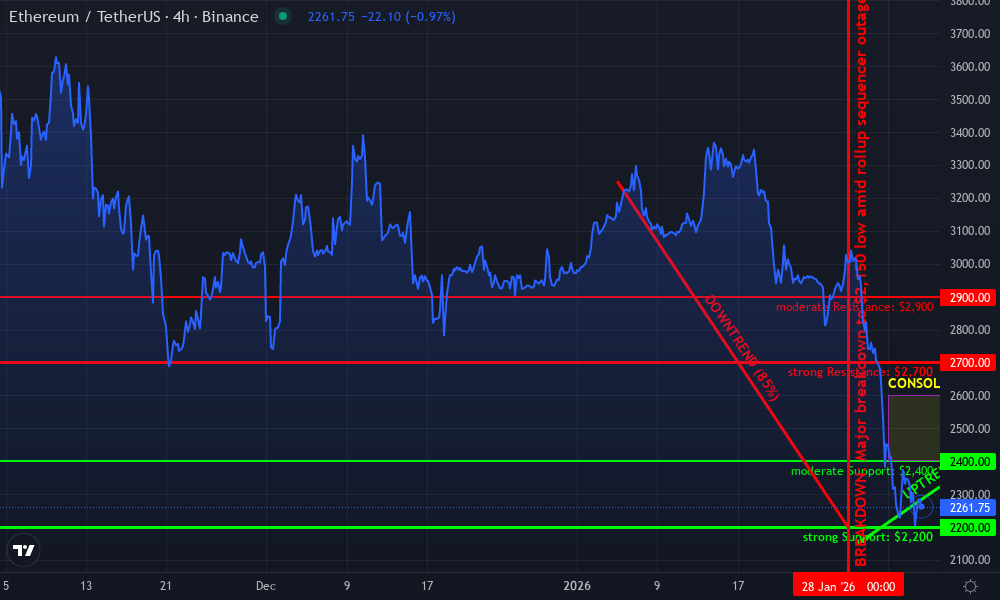
Technical Analysis Summary
To annotate this ETHUSDT chart in my balanced hybrid style, start by drawing a primary downtrend line connecting the January 2026 high at approximately $3,250 (2026-01-05) to the mid-January low around $2,200 (2026-01-28), using 'trend_line' tool with red color for bearish bias. Add a secondary uptrend line from the $2,150 low (2026-01-29) to the recent high at $2,580 (2026-02-12), in green. Mark horizontal support at $2,200 (strong, thick blue line) and $2,400 (moderate), resistance at $2,700 and $2,900 (red lines). Use fib_retracement from Jan high to low for 50% ($2,725) and 61.8% ($2,850) targets. Add rectangle for recent consolidation Feb 1-17 between $2,400-$2,600. Place callouts on volume spike at Jan 28 low ('Capitulation volume') and MACD bearish divergence. Arrow_mark_up at potential entry $2,520. Vertical_line at 2026-02-04 for shared sequencer dashboard update context. Text box for risk: 'Medium risk swing long'.
Risk Assessment: medium
Analysis: Downtrend intact but oversold bounce with fundamental tailwinds from shared sequencers; volatility high in crypto cycles
William Chen's Recommendation: Swing long on confirmation above $2,600, size positions to 2-3% portfolio risk—balance techs with DeFi sequencer watch.
Key Support & Resistance Levels
📈 Support Levels:
- $2,200 - Strong multi-touch low from Jan capitulation, volume confirmation strong
- $2,400 - Recent swing low, minor retest in Feb consolidation moderate
📉 Resistance Levels:
- $2,700 - 50% fib retracement of Jan decline, prior resistance zone strong
- $2,900 - Near Feb initial high, psychological barrier moderate
Trading Zones (medium risk tolerance)
🎯 Entry Zones:
- $2,520 - Breakout above short-term consolidation high with volume, aligning with sequencer bullish catalysts medium risk
🚪 Exit Zones:
- $2,800 - Profit target at 61.8% fib extension 💰 profit target
- $2,380 - Stop loss below recent support and uptrend line 🛡️ stop loss
Technical Indicators Analysis
📊 Volume Analysis:
Pattern: spike on downside lows, drying up on bounce
High volume at $2,150 low indicates capitulation; low volume rally suggests weak but potential reversal
📈 MACD Analysis:
Signal: bearish but histogram contracting
MACD line below signal, negative histogram narrowing—early bullish divergence hinting momentum shift
Applied TradingView Drawing Utilities
This chart analysis utilizes the following professional drawing tools:
Disclaimer: This technical analysis by William Chen is for educational purposes only and should not be considered as financial advice. Trading involves risk, and you should always do your own research before making investment decisions. Past performance does not guarantee future results. The analysis reflects the author's personal methodology and risk tolerance (medium).
Beyond basics, advanced views compare rollups side-by-side, factoring in deployment logs and governance actions. This granularity empowers researchers to dissect why one sequencer network edges out another in decentralization metrics, informing bets on enduring market cycles.
Bridging Visibility Gaps in Rollup Scaling[/h2>
Enterprise teams building on rollups hit ceilings with opaque operations; shared sequencers dismantle them, but only if monitored astutely. Dashboards bridge this by surfacing event histories and upgrade impacts, letting developers correlate chain states with external factors like validator distributions. Halborn's insights underscore advantages: shared networks distribute sequencing, slashing outage risks that plague solo operators.
From Cube Exchange's primer to Sygnum Bank's based rollup advocacy, consensus builds around these benefits. Yet, opinionated as I am, true decentralization hinges on actionable data. SharedSeqWatch. com's historical archives and comparative analysis let users benchmark fairness protocols rigorously, identifying if profit-sharing models in the rollup gold rush truly democratize gains or mask inefficiencies.
Integrating custom thresholds via tools like Grafana transforms passive viewing into active defense. As Ethereum scales, rollup operations monitoring isn't optional; it's the linchpin for sustainable growth, ensuring shared sequencers deliver on their transformative potential.


No comments yet. Be the first to share your thoughts!