
In the evolving landscape of Ethereum rollups in 2026, shared sequencer fairness stands as a critical bulwark against the pervasive threat of Maximal Extractable Value (MEV). As rollups scale transactions to unprecedented volumes, centralized sequencers have inadvertently amplified MEV extraction, where operators reorder transactions to siphon profits through front-running or sandwich attacks. Shared sequencers promise a decentralized alternative, collectively ordering transactions across multiple rollups to foster fair transaction ordering and curb economic centralization. Yet, as a risk manager with years tracking reorgs and sequencer drifts, I caution that true fairness demands rigorous metrics, not just architectural shifts.
The MEV Menace in Layer 2 Scaling
Rollups revolutionized Ethereum by batching transactions off-chain while anchoring to Layer 1 security, slashing costs and boosting throughput. But this efficiency came at a price: sequencer monopolies. A single operator per rollup can censor, reorder, or exclude transactions at will, capturing MEV that once plagued Ethereum's base layer. L2 MEV manifests subtly, from arbitrage bots exploiting user swaps to liquidations timed for maximum pain. Recent analyses reveal that without intervention, sequencer revenues increasingly flow to a handful of operators, mirroring the profit concentration seen in Layer 1.
Enter shared sequencers: networks of nodes serving multiple rollups agnostic of their virtual machines. They aggregate intents, enforce consistent ordering, and enable atomic cross-rollup composability. Platforms like Radius and Movement's M1 exemplify this, deploying slashing for malice and MEV-aware policies that prioritize inclusion time over profit maximization. Still, decentralization alone doesn't guarantee fairness; adversaries can collude in minority Byzantine attacks, as DAG-based studies underscore vulnerabilities in order manipulation.
Core Fairness Metrics for Shared Sequencers
To benchmark these systems effectively, we must quantify fairness through precise metrics. Latency fairness measures variance in transaction inclusion times, flagging if high-value txs leapfrog others. Reorg depth tracks chain reorganizations, a red flag for liveness failures. Censorship resistance ratios assess excluded transactions against total volume, while Gini coefficients on sequencer rewards reveal profit disparities.
Consider encrypted mempools: by blinding sequencers to payload until proposal, they neutralize front-running. Fair sequencing services randomize order via commitments, ensuring transparency. MEV auctions, meanwhile, commoditize reordering rights, redistributing proceeds to stakers or users. At SharedSeqWatch. com, our dashboards plot these in real-time, helping operators spot drifts before they cascade into losses.
Key Fairness Metrics for Shared Sequencers
| Metric | Description | Ideal Threshold | Risk if Breached |
|---|---|---|---|
| Latency Fairness | Variance in transaction confirmation latency across users in the shared sequencer network, ensuring MEV-aware ordering prioritizes timeliness over profit. | < 100ms | User discrimination, front-running exploitation, and erosion of trust in rollup fairness. |
| Reorg Depth | Average depth of chain reorganizations in the sequencer layer, critical for maintaining order fairness in DAG-based or multi-rollup setups. | ≤ 1 block | Instability, transaction loss, increased MEV reordering attacks, and reduced liveness. |
| Gini Coefficient | Measures profit and sequencing power concentration among shared sequencer nodes (e.g., 0.1749 in PoS vs. 0.8358 in ePBS). | < 0.2 | Economic centralization, where few builders capture most MEV value, undermining decentralization. |
| Censorship Ratio | Proportion of transactions unfairly excluded or delayed by sequencers, mitigated by slashing and fair sequencing services. | 0% | Centralized control, loss of censorship resistance, and vulnerability to adversarial MEV strategies. |
Enshrined Proposer-Builder Separation: A Double-Edged Sword
Ethereum's push toward enshrined PBS (ePBS) integrates builder-proposer splits into consensus, aiming to democratize block construction. Proposers attest to builder bids, theoretically diluting MEV capture. But empirical data paints a sobering picture: Gini coefficients for profits ballooned to 0.8358 under ePBS from 0.1749 in PoS, with 95.4% of block value accruing to proposers despite minimal effort. Efficient builders dominate auctions, centralizing content and value extraction.
For shared sequencers, ePBS hybrids could amplify risks if not paired with rollup-specific safeguards. Based rollups, drawing from Ethereum proposers for sequencing, redistribute fees to validators, enhancing incentives. Initiatives like Fabric collaborative stacks seek community-driven infrastructure, but I advise caution: without proven slashing and rotation, these may entrench subtle centralization. Movement's M1 counters this via decentralized ordering and penalties, yet real-world stress tests under high contention remain sparse.
Technical analysis of sequencer performance underscores the stakes. Volatility in order fairness correlates with MEV spikes, demanding vigilant monitoring.
Ethereum Technical Analysis Chart
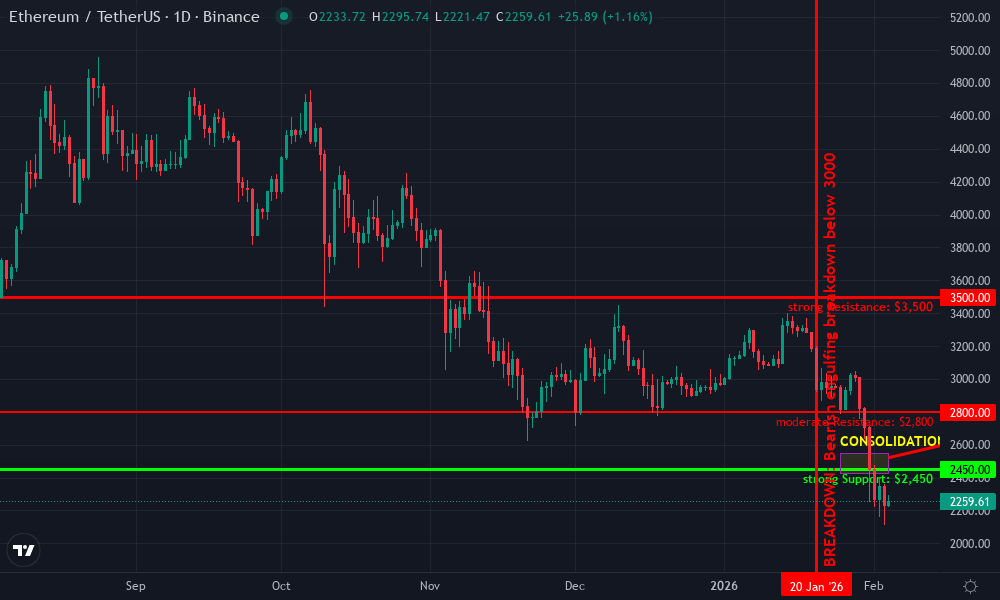
Analysis by Market Analyst | Symbol: BINANCE:ETHUSDT | Interval: 1D | Drawings: 7
Technical Analysis Summary
To annotate this ETHUSDT chart in my balanced technical style, start by drawing a prominent downtrend line connecting the December 2026 peak at approximately 4700 to the current February 2026 price around 2520, highlighting the corrective phase. Add an earlier uptrend line from the October 2026 low near 2300 to the same December peak for context on the prior impulse. Mark key horizontal lines at support 2450 (strong, recent lows) and 2200 (weak, prior base), and resistance at 2800 (moderate) and 3500 (strong). Use a rectangle to outline the recent consolidation range from late January to now between 2420-2550. Place callouts on declining volume during the downtrend and a downward arrow on the MACD bearish crossover near late December. Add fib retracement from the uptrend low to high, targeting 38.2% at ~3700 and 61.8% at ~2900. Vertical line at mid-January for the breakdown event. Entry zone horizontal at 2480 with low-medium risk callout, exits at 2850 profit target and 2420 stop loss. Text notes for MEV/shared sequencer context impacting sentiment.
Risk Assessment: medium
Analysis: Downtrend intact but RSI oversold ~25, sequencer news could spark reversal; medium tolerance fits scaling positions
Market Analyst's Recommendation: Wait for close above 2550 with volume spike before longing, target 2800; avoid shorts near support
Key Support & Resistance Levels
📈 Support Levels:
- $2,450 - Recent swing low, strong volume cluster strong
- $2,200 - Prior base from Oct, psychological weak
📉 Resistance Levels:
- $2,800 - Recent high before breakdown moderate
- $3,500 - 50% fib retrace of rally, prior resistance strong
Trading Zones (medium risk tolerance)
🎯 Entry Zones:
- $2,480 - Bounce from strong support with hammer candle medium risk
🚪 Exit Zones:
- $2,850 - Near-term resistance test 💰 profit target
- $2,420 - Below key support invalidates bounce 🛡️ stop loss
Technical Indicators Analysis
📊 Volume Analysis:
Pattern: declining on downtrend
Weakening volume confirms lack of seller exhaustion
📈 MACD Analysis:
Signal: bearish crossover
MACD line crossed below signal in late Dec, momentum fading
Applied TradingView Drawing Utilities
This chart analysis utilizes the following professional drawing tools:
Disclaimer: This technical analysis by Market Analyst is for educational purposes only and should not be considered as financial advice. Trading involves risk, and you should always do your own research before making investment decisions. Past performance does not guarantee future results. The analysis reflects the author's personal methodology and risk tolerance (medium).


No comments yet. Be the first to share your thoughts!