
In the evolving landscape of Ethereum’s scaling solutions, shared sequencers emerge as a double-edged sword. They promise efficiency by allowing multiple rollups to leverage a single sequencing layer, yet they concentrate power in ways that demand rigorous shared sequencer fairness scrutiny. As a risk manager who’s navigated 14 years of blockchain volatility, I caution that without robust fairness protocols, these systems risk amplifying MEV extraction and transaction biases, undermining the decentralization we all chase.


i will be writing multiple
Picture this: a shared sequencer, drawing from Ethereum L1 validators or decentralized networks like Espresso, processes transactions across chains. It holds visibility into pre-states, dictating order through mechanisms akin to proposer-builder separation. But here’s the rub; if that ordering favors high bidders or insiders, retail users suffer delayed inclusions, eroding trust. Sources highlight how these setups, from weighted leader elections to based rollups transitions, aim to distribute this power, yet real-world validation lags.
Dissecting Shared Sequencer Architectures
At their core, shared sequencers decentralize what was once a centralized bottleneck. Multiple rollups connect to a network of sequencing nodes, as Mikky Snowman outlines, reducing redundancy while inheriting L1’s security. Zeeve notes the sequencer’s order engine adheres to L1 rules, validating transactions before batching. Yet, Ethereum Research warns of the path from centralized to decentralized sequencing, emphasizing progressive steps to avoid disruptions.
This model leverages the entire validator set, per Bridget Harris’s primer, tapping 32 ETH stakes for consensus participation. IMDEA’s deanonymization work underscores validator diversity, but formal verification from Nature stresses epoch processing safety to track attestations and status. In practice, Hord. fi’s validator metrics like attestation success and inclusion delay become proxies for sequencer health, revealing where centralization creeps back in.
Fairness Protocols: The Bulwark Against Bias
Ethereum sequencer fairness hinges on protocols that enforce blind ordering and timestamp fidelity. ETH Zürich’s analysis of front-running defenses shows protocols like threshold encryption or commit-reveal schemes can mitigate MEV abuses in rollups. ScienceDirect proposes multislot weighted elections under PBS, using fuzzy logic to balance leader selection and prevent collusion.
These aren’t theoretical; they’re practical necessities. In shared setups, a sequencer with cross-chain visibility could front-run intents across rollups, prioritizing whales. Fairness protocols counter this via frequent rotations, stake-weighted lotteries, or even L1 attestation integration. My experience assessing reorg risks tells me: protocols without rollup MEV fairness safeguards invite volatility, as seen in early L2 experiments where inclusion delays spiked during congestion.
Updated insights point to adaptable frameworks. TensorFlow’s Fairness Indicators compute disparities across user slices, visualizing biases in ordering models. Tools like FAIR-Checker and FAIRshake, though data-focused, inspire blockchain dashboards by scoring compliance with equitable principles. Imagine applying SHACL shapes to sequencer logs: flagging uneven slot fills or demographic imbalances in tx prioritization.
Validation Metrics That Matter
Enter fairness protocol metrics, the quantifiable heartbeat of these systems. Track latency variance: does the sequencer delay low-gas txs? Measure reorg depth across shared chains; persistent forks signal ordering disputes. Participation rates, borrowed from validator dashboards, reveal if certain nodes dominate slots.
Hord. fi expands this to effectiveness scores, blending inclusion delays with attestation success. For shared sequencers, extend to cross-rollup equity: percentage of txs ordered FIFO versus value-weighted. ETH Zürich evaluates resilience via front-running incidence, post-mitigation drops validating protocol strength. On SharedSeqWatch. com, we benchmark these against baselines, alerting on deviations that threaten capital preservation.
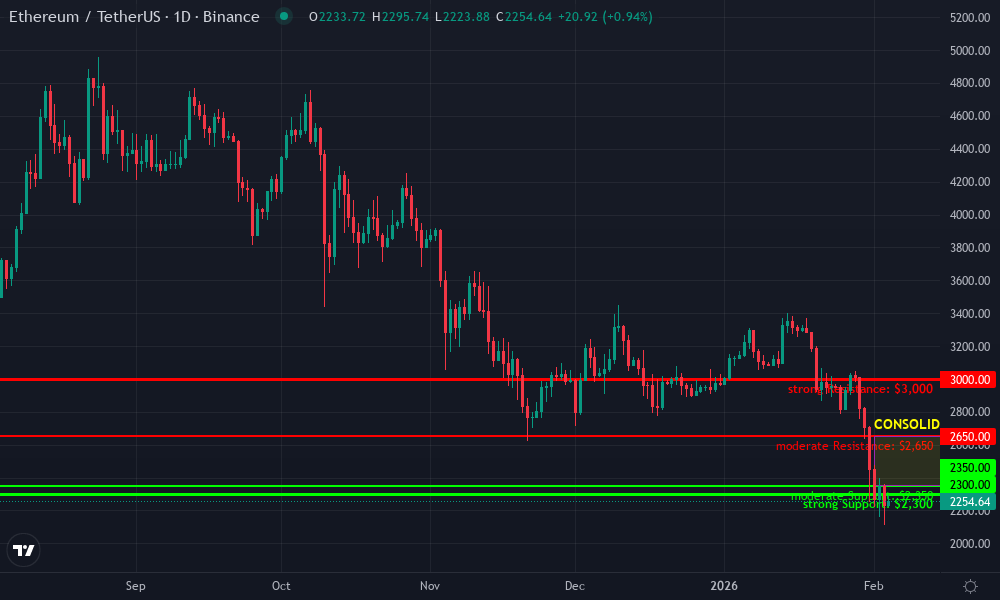
Ethereum Technical Analysis Chart
Analysis by Market Analyst | Symbol: BINANCE:ETHUSDT | Interval: 1D | Drawings: 6
Technical Analysis Summary
Draw a primary downtrend line connecting the swing high around 2026-11-15 at 4850 to the recent low on 2026-02-20 at 2320, using ‘trend_line’ tool. Add a minor uptrend line from the 2026-01-10 low at 2350 to the 2026-02-15 high at 2850. Mark horizontal support at 2300 and resistance at 3000, 4200. Use ‘rectangle’ for the recent consolidation zone from 2026-02-01 to 2026-02-28 between 2350-2650. Place ‘arrow_mark_up’ on volume spike during the bounce from 2320. Add ‘callout’ texts for key levels like ‘Strong Support 2300’ and ‘Bearish MACD crossover’. Use ‘fib_retracement’ from the major high to low for potential retracement levels at 38.2% (around 3300) and 50% (3700). Vertical line for potential news event if any spike noted mid-Dec.
Risk Assessment: medium
Analysis: Clear downtrend intact but signs of exhaustion; medium risk tolerance suits dip buys with defined stops amid sequencer news volatility
Market Analyst’s Recommendation: Consider long positions near support with 1:2 R:R, monitor MACD for confirmation. Avoid overexposure.
Key Support & Resistance Levels
📈 Support Levels:
-
$2,300 – Recent swing low with volume support, strong psychological level
strong -
$2,350 – Prior consolidation base, moderate hold
moderate
📉 Resistance Levels:
-
$2,650 – Immediate overhead from Feb highs
moderate -
$3,000 – Key retracement level and prior support turned resistance
strong
Trading Zones (medium risk tolerance)
🎯 Entry Zones:
-
$2,420 – Near current price post-bounce, above support with bullish candle close
medium risk -
$2,350 – Strong support retest for better R:R
low risk
🚪 Exit Zones:
-
$2,850 – Minor uptrend target, prior resistance
💰 profit target -
$2,280 – Below key support for invalidation
🛡️ stop loss
Technical Indicators Analysis
📊 Volume Analysis:
Pattern: Increasing on downside but spike on recent bounce
Bearish volume trend easing with bullish divergence on rebound
📈 MACD Analysis:
Signal: Bearish crossover in Dec, potential bullish divergence now
MACD histogram contracting, watch for line crossover above signal
Applied TradingView Drawing Utilities
This chart analysis utilizes the following professional drawing tools:
Disclaimer: This technical analysis by Market Analyst is for educational purposes only and should not be considered as financial advice.
Trading involves risk, and you should always do your own research before making investment decisions.
Past performance does not guarantee future results. The analysis reflects the author’s personal methodology and risk tolerance (medium).
These metrics form dashboards that operators ignore at peril. Historical trends expose patterns, like congestion amplifying biases, while real-time alerts enable proactive tweaks. In my view, prioritizing these over raw throughput unlocks true scaling; otherwise, we’re building faster roads to the same old pitfalls.