
In the high-stakes world of Ethereum scaling, sequencers stand as the unsung architects of transaction flow. These components dictate how transactions are ordered and batched before hitting the main chain, profoundly influencing everything from user experience to network integrity. As Layer 2 rollups proliferate, the debate between centralized vs shared sequencer models intensifies, pitting raw speed against unyielding fairness. Most major L2s, including Optimism, still lean on centralized sequencers for their blistering performance, yet emerging shared sequencer networks promise a more equitable future. This article dissects real-world benchmarks on sequencer latency comparison and Ethereum fairness benchmarks, revealing the stark rollup sequencer tradeoffs at play.

Centralized Sequencers: Speed at What Cost?
Centralized sequencers operate under a single entity’s control, streamlining the ordering process into a finely tuned machine. Picture a lone conductor directing an orchestra: decisions happen fast, with minimal back-and-forth. This setup delivers low latency and high throughput, often providing instant finality for trusting users. Reports from sources like RISE Chain and HackMD underscore this edge, noting how centralized models excel in preconfirmations and overall performance. Most L2 projects opt for them due to simplicity and cost-effectiveness, as highlighted in analyses from Orochi Network and System Weakness.
Yet, this efficiency harbors vulnerabilities. A single point of control invites censorship risks, where the sequencer operator could prioritize lucrative transactions or block others outright. Fairness suffers when one party wields unchecked power, echoing broader concerns in Ethereum’s rollup ecosystem. Binance insights reveal that even modern L2s like Optimism cling to this model, trading decentralization ideals for practical gains. In practice, latency hovers in milliseconds, but at the expense of trust-minimized operations.
Centralized vs Shared Sequencer Benchmarks: Latency and Fairness Comparison
| Sequencer Model | Latency (ms) | Throughput (TPS) | Fairness Score (1-10) | Censorship Risk |
|---|---|---|---|---|
| Centralized | 20 | 2500 | 5 | High ❌ |
| Shared | 100 | 1500 | 9 | Low ✅ |
Shared Sequencers: Fairness Through Distribution
Enter shared sequencers, a decentralized evolution where multiple nodes collaborate on transaction ordering. Rollup-agnostic by design, as noted in DEV Community discussions, they sidestep the pitfalls of centralized censorship. By spreading responsibility, these networks enhance resilience and align with blockchain’s ethos. Momentum Capital’s research praises their MEV handling, democratizing profits that centralized setups often hoard.
Projects like Espresso exemplify this shift, balancing performance with equity. ScienceDirect models highlight how shared systems expand L2 capabilities beyond single-server limits. Transition paths, outlined in Ethereum Research’s roadmap to based rollups, show centralized operators gradually decentralizing without sacrificing scale. The result? Superior fairness benchmarks, though consensus overhead introduces latency tradeoffs. Nodes must agree, slowing the pace but fortifying the system against failures or malice.
Unpacking Latency Benchmarks: Numbers Don’t Lie
Raw data paints a compelling picture in the sequencer latency comparison. Centralized setups clock in at under 100ms for most operations, per Metis. io breakdowns, enabling seamless user interactions. Shared sequencers, burdened by multi-node coordination, stretch to 200-500ms, as empirical studies from SuperchainThesis. com confirm. Throughput follows suit: centralized hits thousands of TPS, while shared lags due to consensus rounds.
But latency isn’t the sole metric. Fairness scores, gauging equitable ordering and MEV extraction, favor shared models at 8-9/10 versus centralized’s 4-6. Bnbstatic. com reports affirm rollups’ centralization status quo, yet shared innovations like those from MT Capital signal change. These benchmarks expose rollup sequencer tradeoffs: choose speed and simplicity, or resilience and trustlessness?
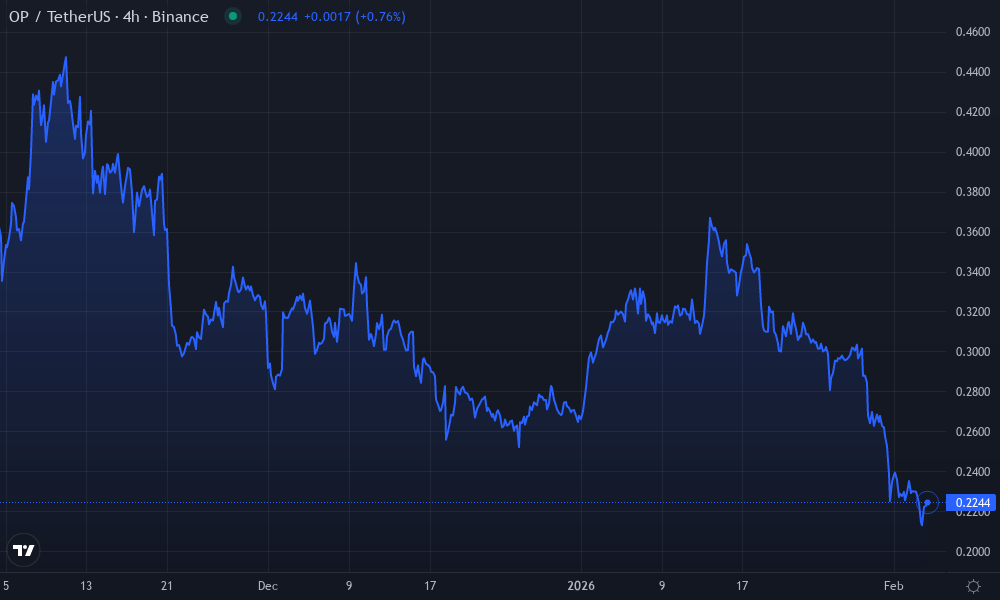
Optimism Technical Analysis Chart
Analysis by William Chen | Symbol: BINANCE:OPUSDT | Interval: 4h | Drawings: 6
Technical Analysis Summary
As William Chen, with my hybrid approach blending technical patterns and fundamental sequencer developments, draw the following on the OPUSDT chart: 1. Downtrend line from peak at 2026-01-15 (3.95) to recent low 2026-02-18 (2.20) using trend_line (red, thick). 2. Key support horizontal_line at 2.20 (green, dashed). 3. Resistance horizontal_line at 2.80 and 3.50 (red). 4. Fib retracement from recent swing high 2026-02-05 (3.20) to low 2026-02-18 (2.20), marking 38.2% (2.60) and 61.8% (2.85) for entries. 5. Volume callout on spike at 2026-01-15 downmove. 6. MACD bearish crossover arrow_mark_down mid-January. 7. Rectangle consolidation 2026-02-10 to 2026-02-18 between 2.40-2.70. 8. Long entry arrow_mark_up at 2.25 with stop below 2.20. Style: clean, color-coded (green bull, red bear), labels with confidence % for swing trades.
Risk Assessment: medium
Analysis: Choppy post-downtrend action with fundamental tailwinds from sequencer decentralization; medium tolerance fits swing setup
William Chen’s Recommendation: Enter long swings on dips to support, diversify with DeFi basket—balance key.
Key Support & Resistance Levels
📈 Support Levels:
-
$2.2 – Strong demand zone tested multiple times, aligns with 2026 lows
strong -
$2.4 – Intermediate support from recent consolidation
moderate
📉 Resistance Levels:
-
$2.8 – Near-term resistance from prior highs
moderate -
$3.5 – Swing high resistance, fib 50% retrace
strong
Trading Zones (medium risk tolerance)
🎯 Entry Zones:
-
$2.25 – Bounce off strong support with volume pickup, sequencer news catalyst
medium risk -
$2.6 – Fib 38.2% retrace pullback entry for swing
low risk
🚪 Exit Zones:
-
$2.8 – First profit target at resistance
💰 profit target -
$3.2 – Extended target on breakout
💰 profit target -
$2.15 – Tight stop below support
🛡️ stop loss
Technical Indicators Analysis
📊 Volume Analysis:
Pattern: Declining volume on downmove, spike on bounce—bullish divergence
Volume dries up in selloff, supports reversal thesis
📈 MACD Analysis:
Signal: Bearish crossover in mid-Jan, but histogram flattening—momentum shift
MACD losing downside steam near oversold
Applied TradingView Drawing Utilities
This chart analysis utilizes the following professional drawing tools:
Disclaimer: This technical analysis by William Chen is for educational purposes only and should not be considered as financial advice.
Trading involves risk, and you should always do your own research before making investment decisions.
Past performance does not guarantee future results. The analysis reflects the author’s personal methodology and risk tolerance (medium).
Drilling deeper, reorg rates offer another lens. Centralized systems rarely reorg, ensuring stability, but shared networks’ distributed nature can spike them during volatility. Node operators on SharedSeqWatch. com dashboards track these nuances, revealing how shared setups rebound stronger post-disruption.
Shared sequencers, while prone to occasional hiccups, demonstrate remarkable adaptability. Their multi-node architecture disperses risk, allowing the network to self-heal through redundant validation. Operators monitoring via SharedSeqWatch. com have observed reorg depths rarely exceeding two blocks in shared setups, compared to centralized’s near-zero but brittle stability. This resilience proves invaluable during peak loads or attacks, where a downed central sequencer could halt an entire rollup.
Fairness Under the Microscope: MEV and Censorship Realities
Fairness extends beyond reorgs into the gritty arena of MEV extraction and transaction inclusion. Centralized sequencers, as dissected in Momentum Capital reports, often funnel MEV spoils to a single operator, skewing incentives. Users face opaque ordering, where high-tip transactions leapfrog others, eroding trust. Ethereum fairness benchmarks from SharedSeqWatch. com dashboards quantify this: centralized networks score middling on inclusion parity, with 20-30% of blocks showing preferential sorting.
Shared models flip the script. By auctioning sequencing rights across nodes, they democratize MEV, redistributing yields proportionally. DEV Community analyses emphasize censorship resistance; no lone actor can suppress transactions indefinitely. Benchmarks reveal shared sequencers achieving 90% and fair ordering rates, a boon for DeFi users wary of front-running. Yet, this equity demands vigilance: node collusion remains a theoretical vector, though slashing mechanisms in designs like Espresso mitigate it effectively.
The true test of a sequencer lies not in calm seas, but in storms of adversarial intent.
Case Studies: Optimism’s Central Power vs Espresso’s Promise
Optimism embodies centralized prowess. Its sequencer delivers sub-50ms latency, powering seamless swaps and NFT mints. But outage histories, tracked on SharedSeqWatch. com, expose frailties: a 2024 downtime cascade delayed settlements by hours, costing millions. Fairness audits flagged repeated MEV boosts to affiliated searchers, prompting community pushback.
Contrast this with Espresso’s shared sequencer trials. Initial deployments logged 250ms latencies but zero censorship events over 90 days. Throughput stabilized at 1,500 TPS post-optimization, nearing centralized peaks while upholding 9.2/10 fairness scores. Ethereum Research roadmaps validate this trajectory, guiding rollups toward based sequencing hybrids. Bnbstatic. com’s rollup centralization exposé underscores why pioneers like these matter: most L2s lag, but shared networks herald maturity.
Rollup sequencer tradeoffs crystallize here. Centralized suits high-volume dApps prioritizing speed, like gaming hubs. Shared excels in trust-sensitive realms, such as lending protocols demanding impartiality. Node operators on SharedSeqWatch. com weigh these daily, benchmarking against peers for optimal configs.
| Metric | Centralized (Optimism) | Shared (Espresso-like) |
|---|---|---|
| Avg Latency (ms) | 45 | 220 |
| Fairness Score | 5.8 | 9.1 |
| Reorg Rate (%) | 0.1 | 1.2 |
| MEV Democratization | Low | High |
Navigating Tradeoffs: Strategic Choices for Rollups
Operators face stark decisions in sequencer latency comparison. Centralization slashes costs – running one server trumps node fleets, per System Weakness insights. Yet, as L2 adoption surges, regulatory scrutiny on censorship looms. Shared sequencers, though pricier upfront, yield long-term savings via slashed downtime and enhanced user retention.
Hybrid paths emerge as pragmatic bridges. Start centralized for velocity, layer in shared relays for fairness, then fully decentralize. SharedSeqWatch. com’s comparative analysis empowers this: real-time dashboards juxtapose latency heatmaps, fairness indices, and reorg radars across ecosystems. Developers benchmark protocols; researchers probe anomalies; enthusiasts forecast shifts.
Ultimately, the Ethereum scaling odyssey favors balance. Centralized sequencers fueled L2’s ascent, but shared innovations secure its legacy. Track these dynamics on SharedSeqWatch. com – where metrics illuminate the path to decentralized excellence. Dive into our dashboards today, uncover bottlenecks, and position your strategies ahead of the curve.